

Sniffer4D Mapper™
Sniffer4D Mapper™ Analytic Software and cloud solutions
Turns air pollution data into
intuitive & actionable information
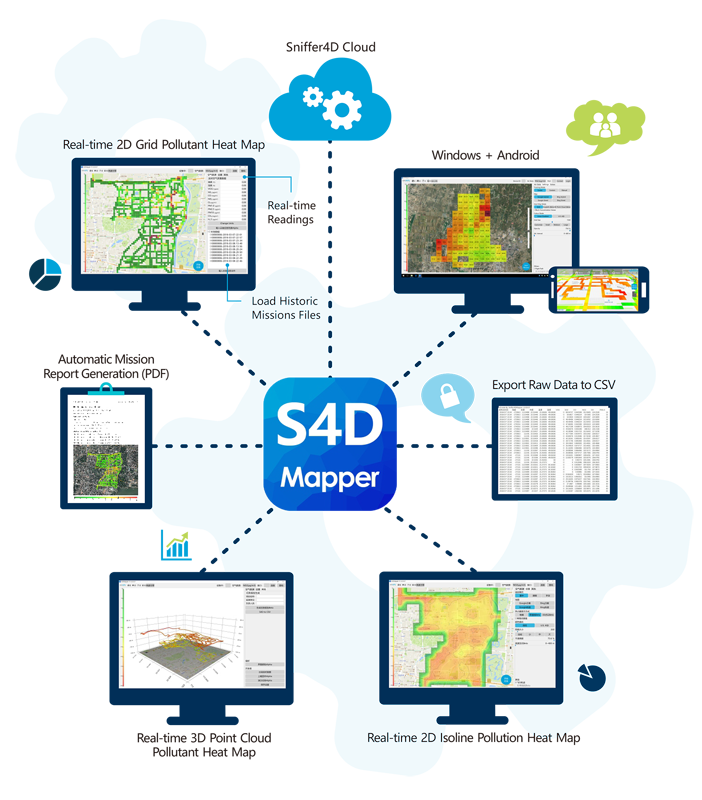
Analyze Data from Sniffer4D in Real Time

3 Types of Visualization
Generate 2D grid, 2D contour, and 3D point cloud air pollution distribution maps.

Load Historical Data for Analysis and Review

Load Orthophoto (GeoTiff, WGS84) into the Software
Users can overlay the orthophoto on top of the obsolete satellite maps.

Sniffer4D Mapper PC
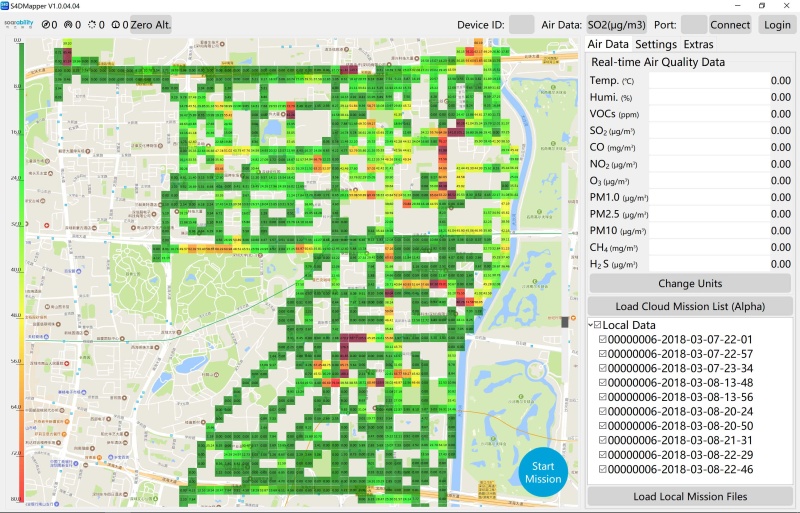
- Choose which pollutant to visualize
- Login to Sniffer4D Cloud
- Real-time concentration readings and time-variant graphs
- Load mission files from Sniffer4D Cloud
- Loaded mission files
- Load local mission files
- 2D grid air pollution heat map (grid size adjustable)
- Concentration & Colour (adjustable)
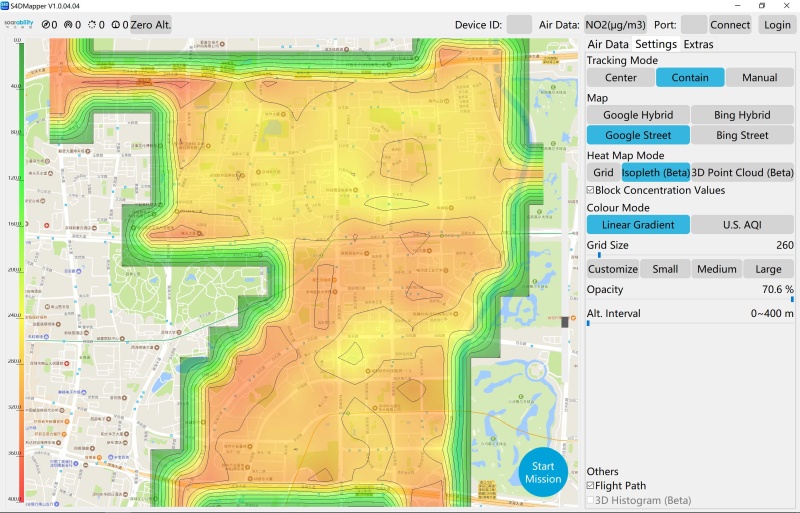
- Follow Sniffer4D™ in the map view
- Map sources
- Choose colour mode
- Adjust heat map opacity
- Start a new mission when Sniffer4D Mapper™ is connected to Sniffer4D™
- 2D countour line air pollution heat map
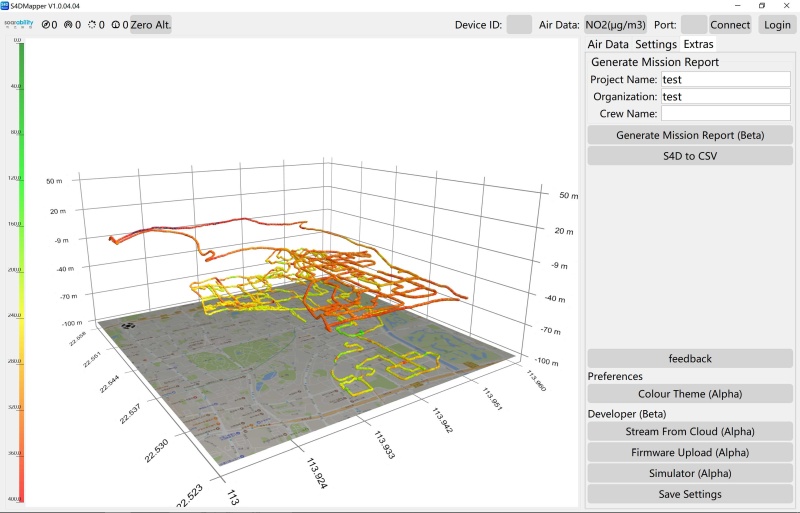
- Automatic mission report generation (PDF)
- Output raw mission data as a CSV file
- Run demo missions
- 3D point cloud air pollution heat map (Hold right buttom and move to alter 3D perspective; click vertical axis to change range; click a point to get its location)
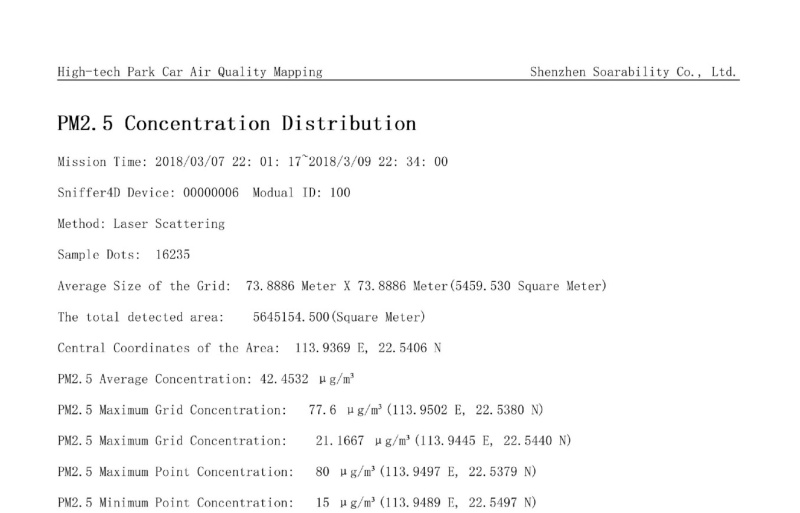
- Automatic mission report generation (PDF) – Includes some of the key results and the grid heat map.
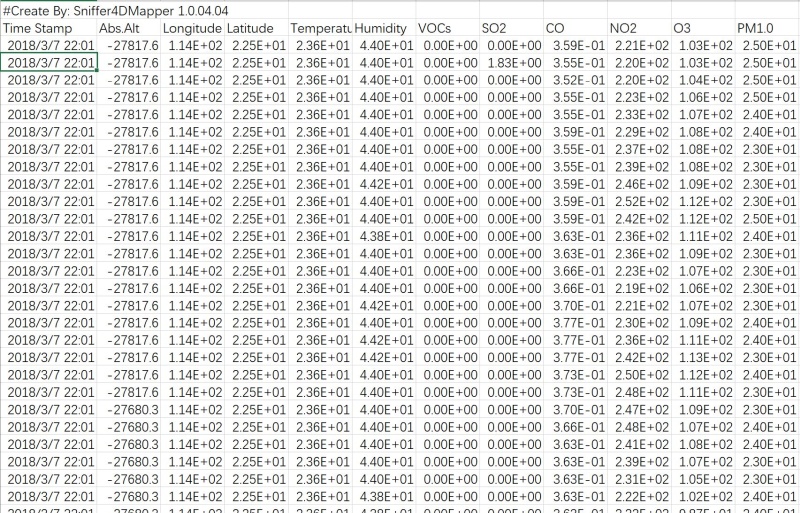
- Export raw mission data – Seamlessly export data to other software such as Matlab、R & MS Excel.